

What gets measured gets managed. And right now, you’re being measured on how well your teams are managing their construction schedules. Most general contractors only rely on industry-standard key performance indicators to assess the health of their projects and keep their schedules on track.
- Financial:
- Gross & net profit margins
- Return on equity reports
- Revenue average per hour worked reports
- Safety:
- Incident reports
- Safety meeting reports
- Lost time injury frequency rates (LTIF)
- Quality:
- Site inspection reports
- Inspection pass ratios
- Call-back and re-work reports
- Performance:
- Progress reports
- Waste reports
- Labor & equipment downtime reports
- Employees:
- Training completion rates
- Employee turnover reports
- Employee satisfaction surveys
But traditional KPIs are based on historical reporting. All prepared reactively and in hindsight. That doesn’t help you run your active projects today. And reactive KPI’s don’t show your teams where to take corrective action tomorrow.
And to make matters worse, this outdated information doesn’t tell you where to step in and provide the critical leadership your teams rely on when and where they need it most.
You need an Intelligent Construction Schedule that works for you -not against you
You need data to make proactive decisions that move the needle and make a difference. Real-time data that helps you and your teams meet your project milestones and beat your schedule deadlines. You need up-to-the-minute information and instant accountability in the field.
So you dig deeper.
Crush Your Construction Schedule Deadlines with These 4 KPI’s
These 4 key performance indicators go granular. They are far more detailed than standard KPIs, because you and your teams are far more detailed and quality driven than industry standard.
Focused on these KPIs, you have a proactive advantage. These key performance indicators measure field activities against the WBS work packages in your construction schedule as they happen. These are the detailed insights that make a winning difference.

This is predictive power and operational excellence
And with your Linarc collaborative project management system, you have access to the power of predictive data before it’s too late.
- Schedule Variance:
You measure actual performance against your Critical Path Method schedule regularly. This KPI gives you predictive insight into what's happening right now. You and your team continually measure actual production results against your baseline target values for better scheduling and more proactive timeline control. - Number of Units Completed:
You track units installed against the work that remains. Your construction scheduling software pulls these figures directly from the schedule of values or unit cost entries. Linarc automatically tracks and updates this data as your supervisors and subcontractors enter their daily work reports. - Cost Per Unit (CPU):
Your cost per unit (CPU) metric measures the total cost of producing one unit of output. It includes direct costs such as labor, materials, and overhead expenses, plus indirect costs such as depreciation and interest. Linarc automatically updates and adjusts this valuable data in real-time as your teams and their subcontractors perform their scheduled work. - Budget Variance:
Of course, you’re concerned about your project finances. But this is different.
Your Linarc project management software pulls data from your schedule of values and the SOVs of your subcontractors and suppliers. The system weighs your project's financial data against the actual costs incurred according to your work breakdown structures and daily logs. Giving you up-to-the-minute insights that make a difference.
Small Hinges Swing Big Doors
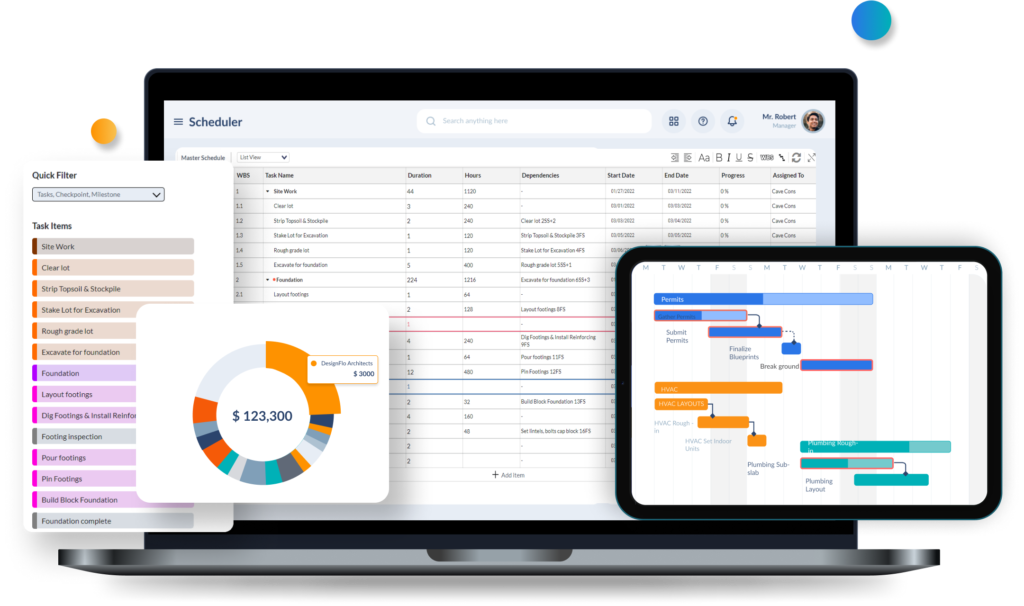
The power here is not so much in the data itself, but in how and when your Linarc project management software delivers the information. Critical, timesaving, schedule-crushing key performance indicators in real time, and at your fingertips.
Your CPU, Schedule Variance, Units Completed, and Budget Variance data all pull from the WBS work packages you set up during pre-construction. And your project scheduling software handles the rest.
You and your teams can track your project KPIs against your schedule projections in real time. This practice ensures that you and your teams meet every daily target.
Any variations in these critical key performance indicators trigger an early response. Giving you the time you need to provide critical support, guidance, and leadership when and where your teams need it most.
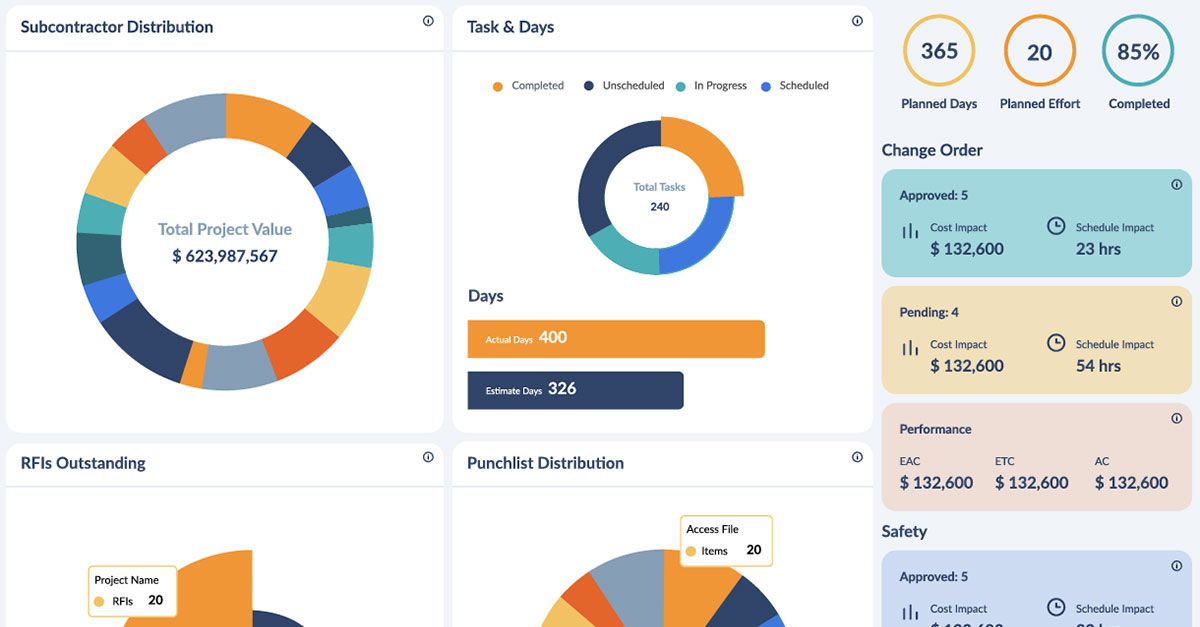
The Critical Key Performance Indicators affecting your Construction Schedule in the Palm of your Hand
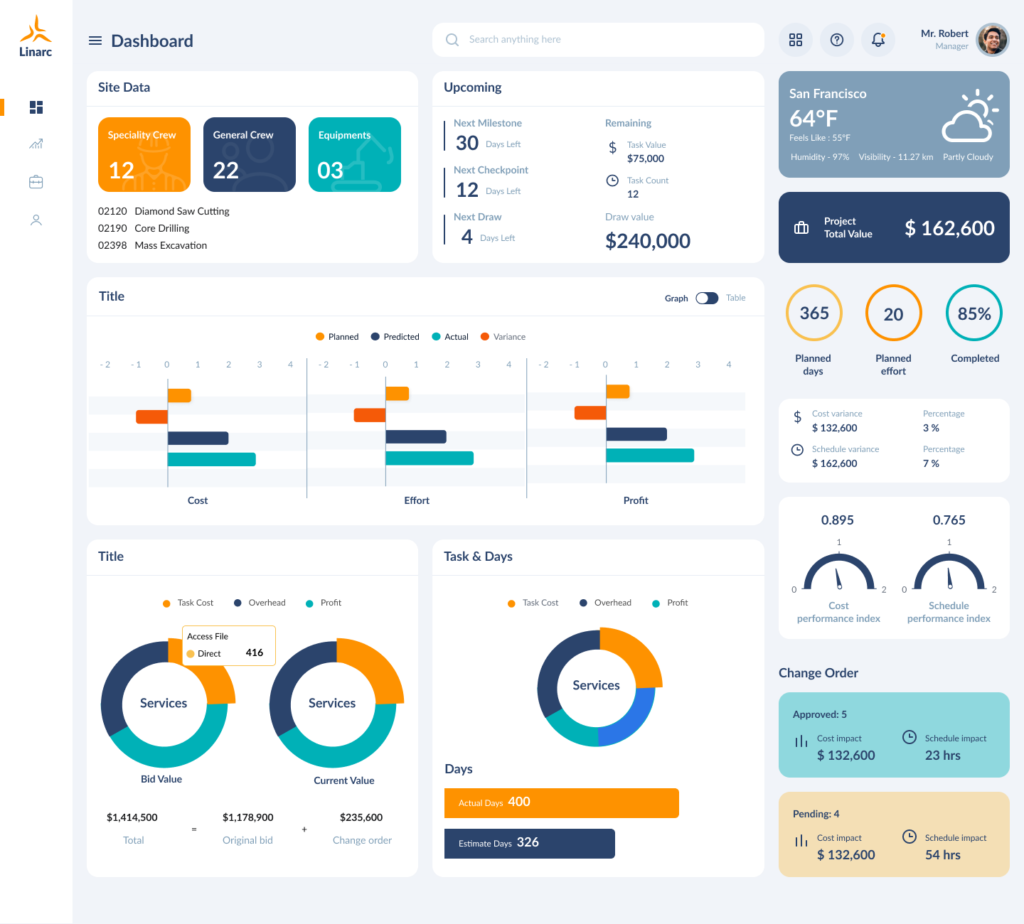
Imagine having precise and detailed reporting not of what HAS happened -but what IS happening -right now! Delivered through a friendly, intuitive, easy-to-use project dashboard wherever you are. In the office, or out in the field.
Now you know, with an absolute certainty, when, where, and how to curb schedule variance. And you can see, with absolute clarity, where, why, and how your project budgets are being affected.
Any potential deviation is immediately apparent because your Linarc visual performance management tool intuitively brings it to your attention.
Linarc delivers an accurate project profile that shows you which processes and teams are operating efficiently, and which requires more of your attention.
Your teams achieve the goals and objectives you set, because everyone is proactively engaged with every critical aspect of the project when it’s most helpful -before things go wrong.
Instead of making guesses, you’re making crucial, timesaving decisions. And that’s the Linarc difference.
Get your free demonstration of the Linarc Collaborative Difference
And lead your teams into the future with Linarc.

.webp)
.webp)